
What are Descriptive Statistics? When to use them and Why?
Statistics is widely used in all forms of research to answer a question, explain a phenomenon, identify a trend or establish a cause and effect relationship. There are two main types of statistics applied to collected data – descriptive and inferential. The names are self-explanatory.
When we collect data from a particular sample or a population to answer our research questions, it is important that we first talk about the broader characteristics of the data. Before we plunge into the details or start generalizing the data and make inferences and extrapolate the findings for an entire population, it is sensible to describe the gathered and tabulated data set.
In this blog, we will briefly discuss what is the various estimates of descriptive statistics, when should we use them and why.
What are Descriptive Statistics?
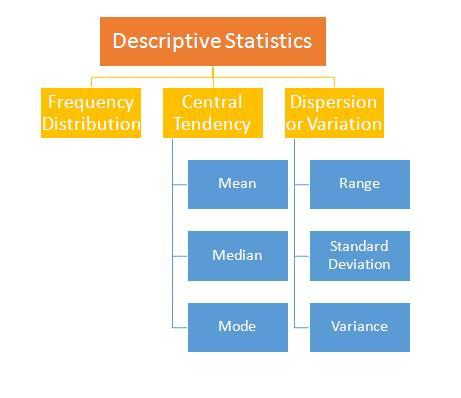
Descriptive statistics present a concise view of a large data set. The explanation of the data set is arrived at using 3 characteristics of the data out of which one is graphical:
- The Distribution of the Dataset
- The Measure of Central Tendency
- The Measure of Dispersion or Variation
Types of Descriptive Statistics
-
The Distribution of the Dataset
Data can be discrete or continuous.
- Discrete data means 1 banana or Male participant.
- Age or weight is the most common example of continuous data set.
The distribution of the dataset is measured using frequency distribution and is presented in graphical form using a bar chart or a histogram.
The histogram is preferred in case of continuous data set as it shows whether the data is normally distributed or left or right skewed. The bar chart is handy if the data is nominal or ordinal.
-
The Measure of Central Tendency
The measures of central tendency are used to show the centre of the data set. The central tendency is estimated using the mean, median and mode.
- Mean is the average of all the data.
- Median is the middle of the entire data set. Usually, the data is sorted in ascending order and the middle value is considered as the mean. You can use the data analysis option in Microsoft Excel too to determine the median.
- Mode indicates the most commonly occurring value in the data set.
Commonly if the mean, median and mode are equal then the data is said to be normally distributed.
The value of the estimates of central tendency help in the next series of characteristics of the data set – dispersion or variation.
-
The Measure of Dispersion or Variation
The objective of measure of dispersion or variation is to identify the extent to which the entire data set is spread from the central tendency – specifically mean.
The commonly used estimates are range, standard deviation, and variance.
- The range is the simplest of the three. It is the difference between the maximum and minimum number in the data set.
- In a normally distributed data set, about 67 – 68% of the data lie within the distance of 1 Standard Deviation from the Mean, 95% within 2 Standard deviations and 99% of the data set within 3 Standard deviations. This takes care of outliers in the data set.
- The variance is the square of Standard Deviation. It helps to find the spread of the data. It is different from Standard Deviation which indicates the concentration of data around the mean and uses the same units.
When should we use Descriptive Statistics?
Suppose your research question wants to determine
- if there are more girls completing a course compared to boys in a chosen sample,
- what percentage of students who have enrolled in a program are males?
- if the average marks scored in the test is more than 52%.
- if the percentage of students passing any course is the same in the university X
In all the above cases, the researcher might gather a large amount of data. The data set might comprise of multiple variables like age, gender, course, ethnicity, marks obtained etc. where the input could be a continuous variable or discrete one. The data set might be of two or more universities having the 5 variables listed.
If there are 500 students in each university and the data is collected from 3 such universities, then the researcher must concise the view of the data to understand its broader aspects, characteristics and trends.
These are instances where descriptive statistics can provide straight-forward answers about a sample especially when the question is about describing the sample or comparing two samples.Comparison of data of two separate samples can be done if the researcher can establish that the samples are large enough to be compared adequately.
The objective is to answer a direct question and not to infer about an entire population. For any kind of inferential statistics in research, the first step is to establish the descriptive statistics from the data. Only in academic questions, the mean, standard deviation or variance is directly given to the students to compute the inferential statistics.
Why do we use Descriptive Statistics?
We use descriptive statistics for the following reasons:
- To create an overview of the entire data set by summarizing it
- To generate an actionable set of information from the large data set having multiple variables
- To segregate the data into homogeneous groups to enable comparison
- To operate on the descriptive statistics’ output (which forms the basis) using inferential statistical tests to generalize about a population or forecast outcomes
Statistics is extensively used in business and management apart from academic purposes. High school and undergraduate students are expected to know basic descriptive and inferential statistics for problem solving and idea generation.
If you have questions about finding the 5 product levels of different products or services or need clarification, leave a comment below and we,at MakeMyAssignments, will get in touch with you.
If you have a very specific need or assignment that needs expert advice or mentoring our subject-matter assignment experts will connect with you to assist you.
In case you need help with writing an assignment or structuring it, please try our efficient assignment writing services and experience quality output and reliable insight.
MakeMyAssignments provides excellent assignment writing services and mentoring to students around the globe. We have long-standing relationship with many students over the years and some of them are part of our assignment expert network sharing their knowledge and insight to help other students attain their education objectives and career goals.
Our assignments are meant to be guidance material for students and we discourage the direct submission of the material to their college or universities.